Google Search Console
For SEO
Want to know how your site actually performs in Google search results?
The Importance Of Google Search Console For SEO
Get SEO Data That You Can Actually Use
Find out how Google evaluates your website. Receive laser-focused reports with decoding keyword ranks, click-through rates, and impressions.
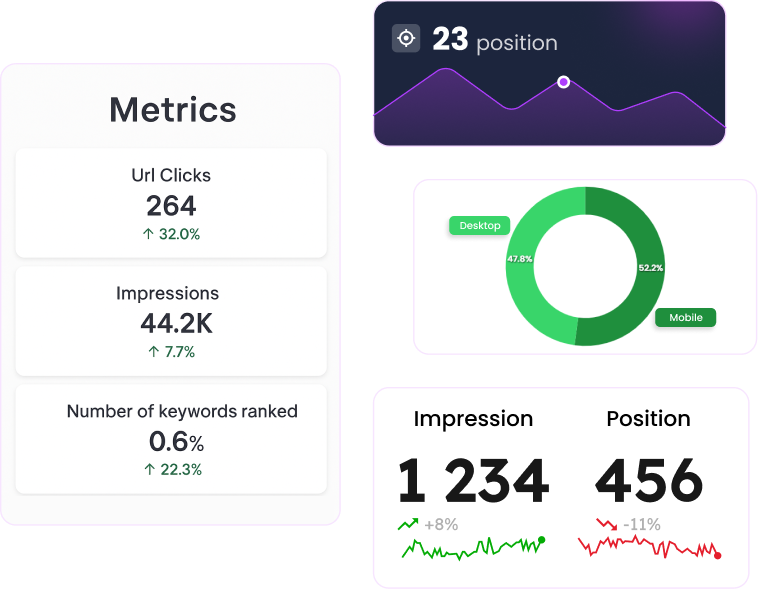
The Clear-Speaking Metrics Dashboard
Tired of switching between tabs just to figure out your search performance? Our Metrics Dashboard simplifies with visualized graphs displaying total clicks, impressions, click-through rate (CTR), and average position over time.
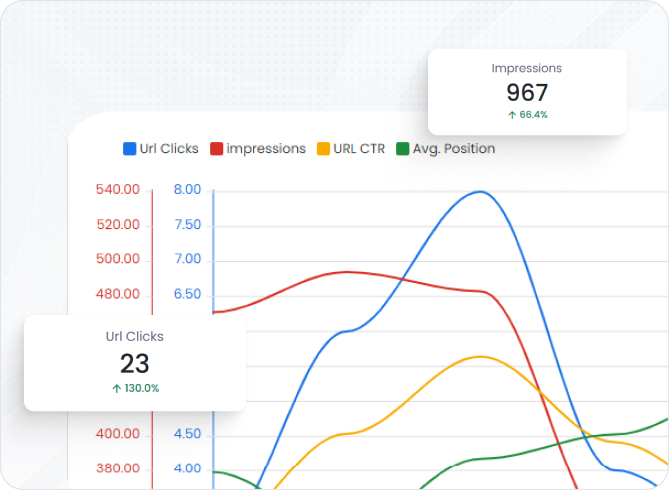
Easily switch between metrics to catch dips or increases, track SEO performance weekly or monthly, and know which content updates truly affect visibility.
You can also find a chart with accurate details that shows results in different time frames. This dashboard is ideal for agency reporting as well as internal tracking.
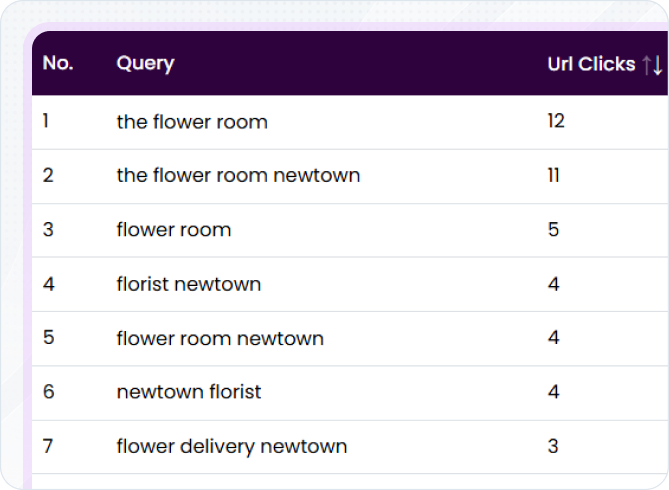
Query Detail List: The Why Behind the Clicks
Your search behavior says it all, and we assist you in hearing it, too. The Query Detail List depicts every search query and the triggered pages, as well as the user's country and a very specific time slice.
Filter by date or country to compare seasonal trends, regional performance, or particular campaign timeframes. Compare search queries to landing pages and verify keyword targeting precision.
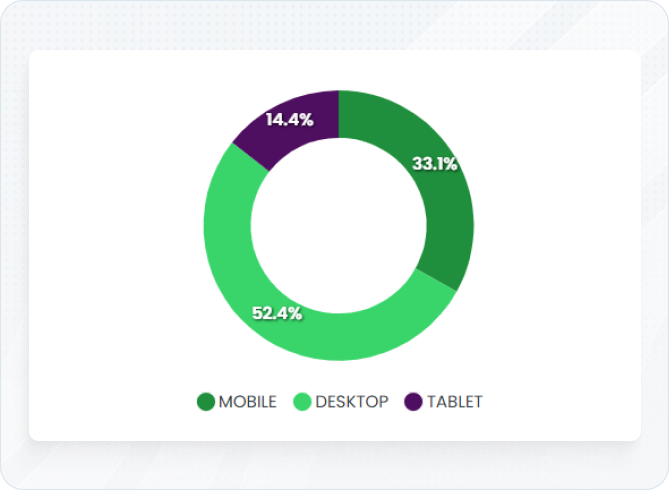
Device-Type Reports: Optimize for Every Screen
Mobile, desktop, or tablet - understanding where your users are coming from is essential to SEO. Our tool analyzes clicks, impressions, CTR, and average position by device in simple-to-understand pie charts.
Utilize this feature to improve page speed and UX on devices. If your mobile impressions are great but CTR is lacking, our visual insights help improve overall design choices.
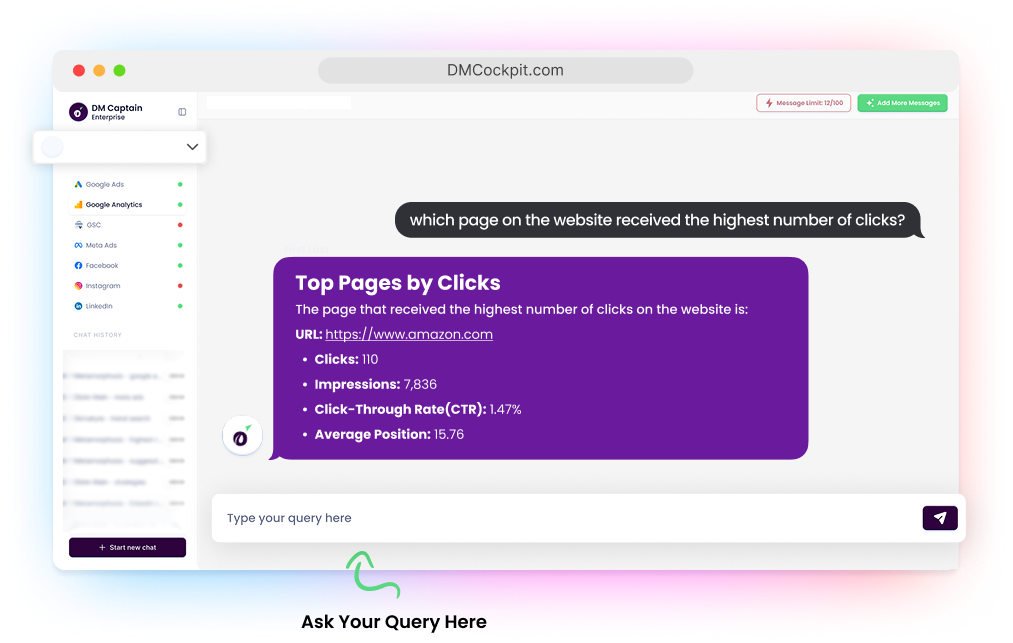
DM Captain: The AI-Powered Chatbot That Knows Your SEO
Skip the setup. Just ask and get accurate answers in seconds.
Try asking “which page on the website received the highest number of clicks?” and get results with details like Impressions and Click-Through Rate (CTR). Join DM Cockpit and use DM Captain for FREE.
Made for Marketers, Built to Make You Fast
Track the performance of SEO campaigns
Share open results with stakeholders
Spot keyword and content opportunities
Track technical issues by position and clicks
Why DM Cockpit is Your SEO Co-Pilot
Scheduled, automated SEO reporting
Instant one-click data exports
Clean, client-friendly SEO graphics
Multi-platform integration:
Unlock the True Potential of Google Search Console For SEO with DM Cockpit
Ready to take your SEO to the next level? Learn more about our Google Search Console Report tool and how you can help reveal new reporting, tracking, and digital marketing strategies.